

IBM SPSS Statistics is one of the most widely used and trusted tools in the world for organizing numbers, running statistical tests, and conducting research. From university classrooms and hospitals to market research firms and growing businesses, teams collect a ton of data every single day. But turning raw survey sheets, customer feedback, and sales spreadsheets into smart business decisions takes the right tools and a clear approach.
Collecting data is easy—using it to make confident decisions is the hard part. To get real value from your numbers, you need to clean up messy files, test whether differences between groups are real, spot trends, and share simple reports that anyone on your team can understand. In this guide, we take a friendly, practical look at IBM SPSS Statistics: what it does, where it shines, where it has limits, and how it compares to tools like Excel, Python, and Power BI.
We will also look at how Buyra helps companies bridge the gap between heavy statistics and everyday business—turning complex numbers into custom dashboards, automated tools, and practical growth strategies.
1. What is IBM SPSS Statistics?
Originally called the Statistical Package for the Social Sciences (and now built by IBM), IBM SPSS Statistics is a software program designed to help you analyze numbers, manage datasets, and build clean reports. Today, it is used everywhere—from university labs and healthcare networks to marketing agencies and corporate offices.
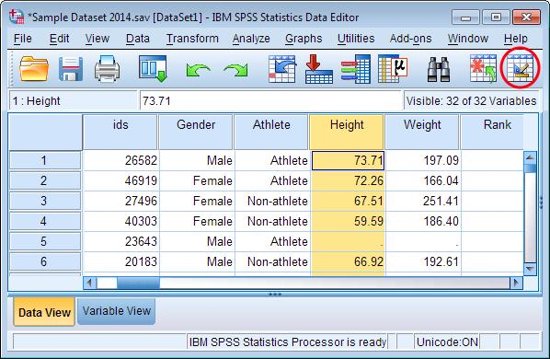
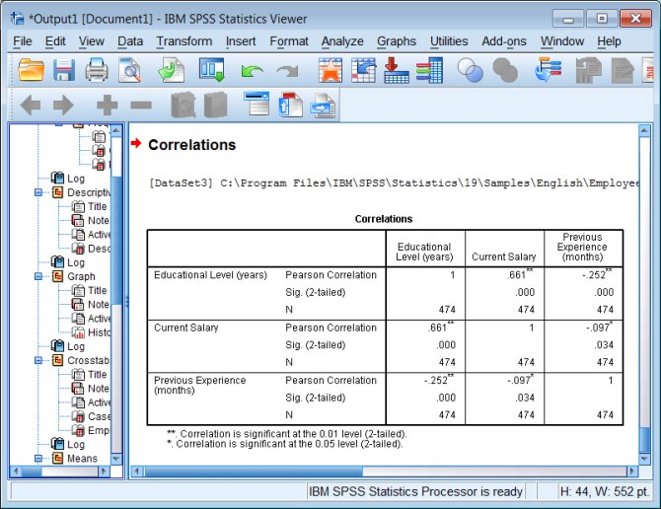
Think of SPSS as a supercharged calculator built specifically for research and surveys. It helps you organize your rows and columns, test whether trends in your data are real or just random luck, see how different variables relate to each other, and turn findings into clean charts and summary tables. It handles everything from simple averages and percentages to advanced tools like correlation, regression, hypothesis tests, and ANOVA (comparing different groups).
It is especially helpful when dealing with survey responses, customer feedback forms, medical trials, and sales logs. Best of all, it comes with a friendly, point-and-click menu. You don't have to be a software developer or write lines of programming code to run advanced statistical tests. By making hard math simple, SPSS helps decision-makers stop guessing and start making choices backed by real proof.
2. Core Features and Capabilities
SPSS brings together heavy mathematical power and simple everyday menus. Its main features can be grouped into six areas:
- Data Management: Easily bring in data from Excel files, online surveys, and databases, and clean up messy entries, missing fields, or duplicate rows.
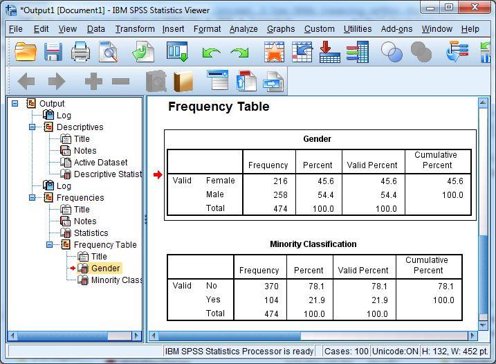
- Descriptive Statistics: Calculate quick summaries like averages, medians, standard deviations, and percentages to get a fast snapshot of your data.
- Statistical Testing: Run standard tests (like t-tests, chi-square tests, and ANOVA) to see if differences between groups are statistically real or just random chance.
- Regression Analysis: Discover how different factors connect—helping you figure out what actually predicts sales, customer churn, or product demand.
- Data Visualization: Turn walls of boring numbers into clear bar charts, scatter plots, and histograms that anyone on your team can read.
- Clean Report Outputs: Automatically generate neat summary tables and logs that are ready to drop into presentations, proposals, or reports.
3. Real-World Applications Across Industries
Because every organization collects data, SPSS is used across many different fields. Here is how different industries use it in everyday work:
| Industry / Sector | How They Use SPSS |
|---|---|
| Education & Academia | Checking student exam grades, reviewing course surveys, tracking admissions trends, and conducting academic research. |
| Healthcare & Medicine | Evaluating patient health records, testing clinical trial results, studying disease patterns, and measuring hospital service quality. |
| Business & Commerce | Measuring customer satisfaction, evaluating store foot traffic, testing new pricing ideas, and improving daily operations. |
| Banking & Finance | Assessing loan risk, studying economic trends, reviewing long-term financial patterns, and spotting unusual transactions. |
| Social Sciences | Studying human behavior, tracking population changes, analyzing census records, and reviewing public policy feedback. |
| Marketing & Sales | Understanding what customers like, checking ad campaign results, and finding out why people buy one product over another. |
4. Advantages and Limitations of SPSS
Like any software tool, SPSS has strong advantages along with a few practical drawbacks. Knowing both helps you choose the right tool for your project.
Key Advantages
- Easy Point-and-Click Menus: You don't have to learn programming languages like Python or R to run advanced statistics.
- Fast and Reliable: It crunches through thousands of rows of survey and customer data in seconds without crashing.
- Complete Set of Tests: Comes out-of-the-box with almost every statistical test you will ever need, from basic percentages to complex models.
- Presentation-Ready Tables: Outputs are cleanly formatted and ready to paste directly into documents and slide decks.
- Trusted Everywhere: Recognized and accepted worldwide by universities, medical journals, and enterprise companies.
Practical Limitations
- License Costs: It is commercial software, and buying full licenses can be expensive for small teams or startups.
- Less Flexible than Custom Code: If you need unique, custom algorithms or custom machine learning pipelines, languages like Python give you more freedom.
- You Still Need Basic Stats Knowledge: The computer does the math, but you still need to know which test to pick and how to read the results.
- Limited Live Automation: Setting up automatic, minute-by-minute data updates usually requires extra software and engineering.
- Not Built for Massive "Big Data": When files grow into millions of unstructured rows, cloud databases and data warehouses perform much faster.
5. Target Users and Everyday Use Cases
People in all kinds of roles use SPSS to make sense of numbers. Here are the most common users and what they use it for:
| User Group | What They Use It For |
|---|---|
| Researchers & Scientists | Running experiments, validating research hypotheses, and preparing studies for academic publication. |
| University Students | Completing statistics assignments, analyzing survey data, and writing final-year dissertations. |
| Business Analysts | Checking sales numbers, spotting quarterly trends, and making sense of customer feedback. |
| Market Researchers | Writing consumer surveys, grouping target audiences, and comparing product preferences. |
| Doctors & Healthcare Staff | Reviewing patient recovery rates, testing new treatments, and checking clinic performance. |
| Government Agencies | Looking at national census numbers, public feedback forms, and the impact of public programs. |
6. Applications in Modern Business Analytics
In a growing business, SPSS helps bridge the gap between collecting spreadsheets and actually taking action. By looking at past records and connecting the dots between variables, companies can stop relying on guesswork and make moves based on hard evidence.
Here are some of the most common ways businesses use it:
- Understanding Customer Behavior: Spotting buying habits, favorite product features, and the early warning signs of customers about to leave.
- Market Research & Positioning: Listening to survey feedback from hundreds of buyers to see what products or services they actually want next.
- Sales Trend Checks: Looking back at sales history to spot seasonal busy periods, regional differences, and top-earning products.
- Customer Satisfaction Tracking: Measuring review scores (like CSAT and NPS) to fix customer service headaches before they hurt revenue.
- Predictive Planning: Using statistical regression models to estimate future sales, customer renewals, or upcoming stock requirements.
- Confident Decision-Making: Giving managers and founders factual proof so they can invest budgets and hire staff with peace of mind.
7. SPSS Within the Modern Data Ecosystem
SPSS is just one part of a modern data toolkit. Knowing how it compares to everyday tools like Excel, Python, R, and Power BI helps you build a setup that fits your team's budget and skills.
| Tool | Main Purpose | Where It Works Best |
|---|---|---|
| IBM SPSS Statistics | Focused statistical testing & survey analysis | Survey analysis, comparing test groups, regression models, and research papers. |
| Microsoft Excel | Everyday spreadsheets & quick calculations | Quick data entry, simple math, budgets, and preliminary pivot tables. |
| Python | Custom coding, automation & machine learning | Automated data pipelines, heavy data cleaning, AI models, and big web apps. |
| R | Advanced statistical programming & custom charts | Deep academic statistics, bespoke algorithms, and complex scientific plots. |
| Microsoft Power BI | Live business dashboards & visual reporting | Real-time business dashboards, tracking team KPIs, and sharing visual reports with leadership. |
You don't have to pick just one tool—smart teams use them together. For example, you might collect basic records in Excel, use SPSS to run deep statistical checks, write a Python script to automate the data cleaning, and build a Power BI dashboard so your whole team can watch progress in real time.

8. How Buyra Bridges Statistics with Real-World Engineering
At Buyra, we believe that statistics are only helpful when they help your business take real action. Running a test in SPSS is great, but to make a lasting difference, you need clean data pipelines, easy web tools, and live dashboards that your team uses every single day.
Here is how we help businesses put numbers to work:
- Reliable Statistical Analysis: We dig into your spreadsheets and databases, finding real patterns and filtering out random noise.
- Customer & Market Insights: We turn messy feedback forms and survey sheets into clear takeaways that guide your growth.
- Business Performance Checks: We link your historical sales and costs with daily operations to discover what genuinely drives your profit margins.
- Predictive Forecasting: We build models that help you predict customer renewals, sales volume, and inventory needs ahead of time.
- Clear, Simple Reporting: We translate dense statistical tables into friendly visual dashboards that anyone on your team can understand in minutes.
9. Potential Business Solutions Powered by Statistical Analytics
By pairing statistical analysis with modern custom software, Buyra designs and builds practical solutions that solve common data headaches:
Statistical Research and Analysis Solutions
Tailored tools built for universities, clinics, and research teams to simplify data cleaning, test hypotheses, and create ready-to-publish summaries.
- Survey Data Preparation: Cleaning up messy entries, missing fields, and duplicates from survey responses.
- Descriptive Statistical Analysis: Calculating averages, medians, and spreads so you get an immediate clear picture.
- Correlation & Regression Modeling: Seeing how different variables connect and what predicts better outcomes.
- Hypothesis Testing: Running t-tests, ANOVA, and chi-square tests to confirm whether differences between groups are real.
- Clear Report Summaries: Generating clean tables and summaries ready for academic papers or executive reviews.
Customer Satisfaction Analysis Solutions
Custom analytics tools that help companies track customer reviews, calculate satisfaction scores, and find out what keeps customers loyal.
- Customer Feedback Ingestion: Bringing together feedback from emails, forms, and support tickets into one organized place.
- Satisfaction Measurement: Calculating accurate CSAT and NPS scores with proper mathematical weighting.
- Customer Preference Analysis: Finding out what features your customers love and what common issues frustrate them.
- Satisfaction Trend Identification: Watching how customer sentiment shifts month-over-month so you catch problems early.
- Actionable Analytical Reports: Delivering clear, simple recommendation reports that your support and product teams can act on immediately.
Market Research Analytics Solutions
Market intelligence tools designed to help businesses make sense of customer surveys, understand buying habits, and launch new products with confidence.
- Survey Response Synthesis: Sorting through hundreds of market survey replies to pull out the most important findings.
- Demand & Preference Modeling: Discovering what customers are willing to pay and which new offerings they want most.
- Audience Market Segmentation: Grouping your customer base into clear categories based on their habits and needs.
- Comparative Benchmark Analysis: Comparing your latest survey findings against past performance to track progress.
- Visual Statistical Reporting: Creating clean, engaging chart summaries that leadership can review in minutes.
Business Performance Analysis Solutions
Custom software applications that help business owners inspect company health using past operational logs and financial figures.
- KPI Diagnostics: Looking closely at your revenue drivers, top products, and major departmental costs.
- Multi-Period Performance Comparisons: Comparing performance across months, seasons, and quarters to see where you are growing.
- Operational Variable Correlation: Identifying which daily operational factors actually push your profit margins up or down.
- Visual Executive Summaries: Pairing simple numbers with intuitive graphs so leadership gets the full picture right away.
- Data-Driven Decision Support: Giving business leaders factual proof so they can hire, budget, and expand with total confidence.
Centralized Statistical Analytics and Reporting Platforms
Modern, cloud-based web portals that let your whole company store datasets, run calculations, and download clean reports from a single screen.
- Centralized Dataset Management: Storing all your business files safely in one organized, cloud-hosted space.
- Statistical Engine Connectors: Connecting directly to statistical tools like SPSS, Python, or R behind the scenes.
- Dynamic Result Visualization: Showing interactive charts, graphs, and metric cards that update as new numbers arrive.
- Automated Report Compilation: Downloading one-click PDF summaries or Excel sheets whenever you need them.
- Role-Based Access Governance: Setting simple, secure permissions so team members only see what they need to see.
10. Aligning Analytics Services with Business Growth
To help companies at every stage of growth, Buyra provides a complete set of technology services. Here is how our services connect with everyday data analysis:
| Buyra Service | How It Connects to Data & Analytics |
|---|---|
| Data Analytics Systems | Building custom platforms that help companies store their files, run calculations, and get clear business insights. |
| Business Intelligence Suites | Bringing together numbers from different spreadsheets and software into one central dashboard. |
| Power BI Dashboard Engineering | Creating live, interactive dashboards that show team performance, sales numbers, and key trends at a glance. |
| Data Engineering & Pipelines | Automating the collection and cleaning of messy data so it is always accurate and ready for analysis. |
| Machine Learning Solutions | Using smart algorithms to predict customer churn, estimate demand, and personalize recommendations. |
| Custom Enterprise Software | Building custom internal tools tailored specifically to how your business manages its data. |
| Custom SaaS & Web Apps | Creating web portals with user logins, database storage, and automated reporting. |
| AI Automation Solutions | Automating repetitive data entry, file sorting, and routine report drafting to save hours of manual work. |
| Cloud Infrastructure | Setting up secure, reliable cloud hosting so your analytics apps run fast and stay online 24/7. |
11. Key Business Opportunities in Data Analytics
Almost every company collects data, but very few know how to turn that data into real business momentum. Combining clean software with proven statistical methods opens up valuable opportunities across many industries:
- Academic & University Research Support: Helping university teams organize complex survey datasets, run statistical tests, and format findings for academic journals.
- Customer Satisfaction Intelligence: Helping consumer brands analyze customer reviews, spot churn risks early, and build better loyalty programs.
- Unified Business Intelligence for SMEs: Pulling scattered spreadsheets, POS logs, and bank records into clean dashboards that track profits and cash flow.
- Healthcare & Clinic Data Management: Helping medical clinics organize treatment records, survey patient feedback, and ensure data privacy.
- Predictive Forecasting & Demand Estimation: Combining past sales trends with smart models to help businesses order the right amount of stock and staff shifts accurately.
- Custom Automated Reporting Portals: Replacing tedious, copy-paste Monday spreadsheets with modern web portals that update reports automatically.
12. The 5 Stages of a Complete Analytics Workflow
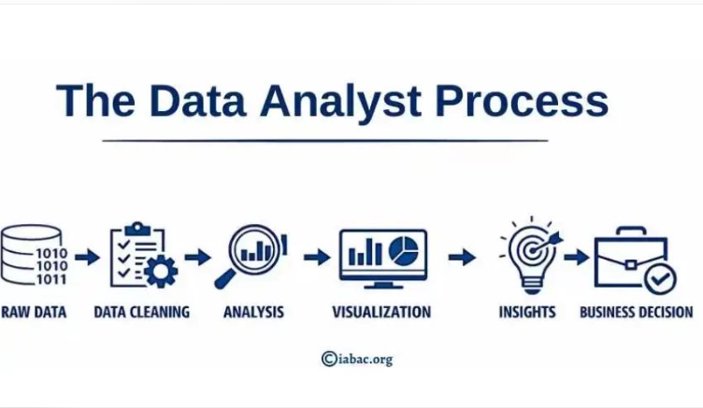
Statistical tools work best when they follow a simple, step-by-step process. Each stage builds on the last to turn raw numbers into clear, practical decisions:
- Data Collection: Pulling information from spreadsheets, checkout registers, web forms, and customer support software.
- Data Preparation & Cleansing: Fixing typos, removing duplicates, and organizing messy tables so the data is reliable.
- Statistical Analysis: Using SPSS to calculate averages, test whether differences are real, and spot strong correlations.
- Data Visualization & Reporting: Turning output tables into visual charts and interactive dashboards using tools like Power BI.
- Strategic Decision-Making: Using the clear takeaways to adjust pricing, fix operational bottlenecks, and invest with confidence.
13. Target Industries and Everyday Client Needs
Different fields face different challenges with their data. Tailoring the tools to the industry is key to making analytics actually useful:
| Industry | What They Usually Need |
|---|---|
| Higher Education & Academics | Tracking student retention, testing research hypotheses, evaluating new courses, and reviewing campus surveys. |
| Healthcare & Medicine | Checking patient recovery rates, tracking clinic feedback, studying trial results, and maintaining patient privacy. |
| Retail & Supermarkets | Seeing what items people buy together, tracking customer loyalty, planning holiday stock, and optimizing store revenue. |
| Banking & Finance | Assessing borrower risk, reviewing long-term financial patterns, tracking portfolios, and spotting suspicious transactions. |
| Government & Public Sector | Reviewing public health statistics, studying census numbers, checking program impact, and gathering citizen feedback. |
| Hospitality & Tourism | Analyzing guest reviews, tracking seasonal room bookings, improving service quality, and adjusting seasonal pricing. |
| Research & Think Tanks | Studying social trends, running public surveys, building statistical models, and writing clear policy reports. |
14. Practical Things to Keep in Mind Before Starting
Before launching an analytics project or buying SPSS licenses, here are seven simple, practical factors to check:
- Data Availability: Make sure you have enough data history and records to make your statistical tests meaningful.
- Data Quality: If you feed messy, incomplete files into SPSS, you will get misleading results. Always clean your files first.
- Software Licensing: Check the pricing plans and make sure the license tier you pay for includes the features you actually need.
- Data Privacy & Security: Protect sensitive customer, patient, and employee information, and make sure you follow data protection laws.
- Basic Statistical Knowledge: The software does the heavy math, but your team still needs to understand what the numbers mean so you don't pick the wrong test.
- Connecting Your Systems: Link SPSS with your everyday databases and dashboards so you don't waste hours manually moving files around.
- Focusing on Real Business Goals: Always start with a clear question (like "Why are customers canceling?") instead of running tests aimlessly.
15. Helpful Content and Knowledge Sharing
Teams everywhere are looking for simple, honest guidance on how to make sense of their numbers. Sharing easy-to-understand educational content helps demystify data for everyone:
- Beginner-Friendly Guides: Explaining statistical concepts and everyday features in plain, simple English without confusing jargon.
- Step-by-Step Tutorials: Creating simple walkthroughs for common tasks like survey cleaning, hypothesis testing, and regression.
- Real Business Case Studies: Showing how real companies solved everyday problems—like customer churn or margin drops—using data.
- Honest Tool Comparisons: Comparing SPSS, Excel, Python, R, and Power BI so teams can pick the right software for their budget.
- Practical Frameworks: Showing how data pipelines, statistics, and dashboards connect to solve business problems.
16. Conclusion: Turning Numbers into Confident Action
Statistical analysis is not just an academic exercise—it is a practical tool that helps you stop guessing and start running your business with certainty. While IBM SPSS Statistics gives you the mathematical power to test and prove what is really happening in your data, the real magic happens when those numbers turn into everyday action.
At Buyra, that is what we help you do. We take proven statistical methods and combine them with modern custom software, cloud engineering, and easy-to-use dashboards—helping you turn complex numbers into simple steps that drive real, lasting progress.